
Where Did 1.13 Billion Ounces of Silver Go?
Six categories, one year of silver demand. Start small and follow the ounces to the largest category.
A film camera, a silver necklace and a field of solar panels all have a claim on the same metal. In 2025, two categories finished just 2.7 million ounces apart. How would you rank the whole list?
Start at No. 6 and count up through a year of global silver demand. These are estimates of where demand came from, not an inventory of all the silver already in the world.
The countdown
6 in the countdown
Photography
2025 demand
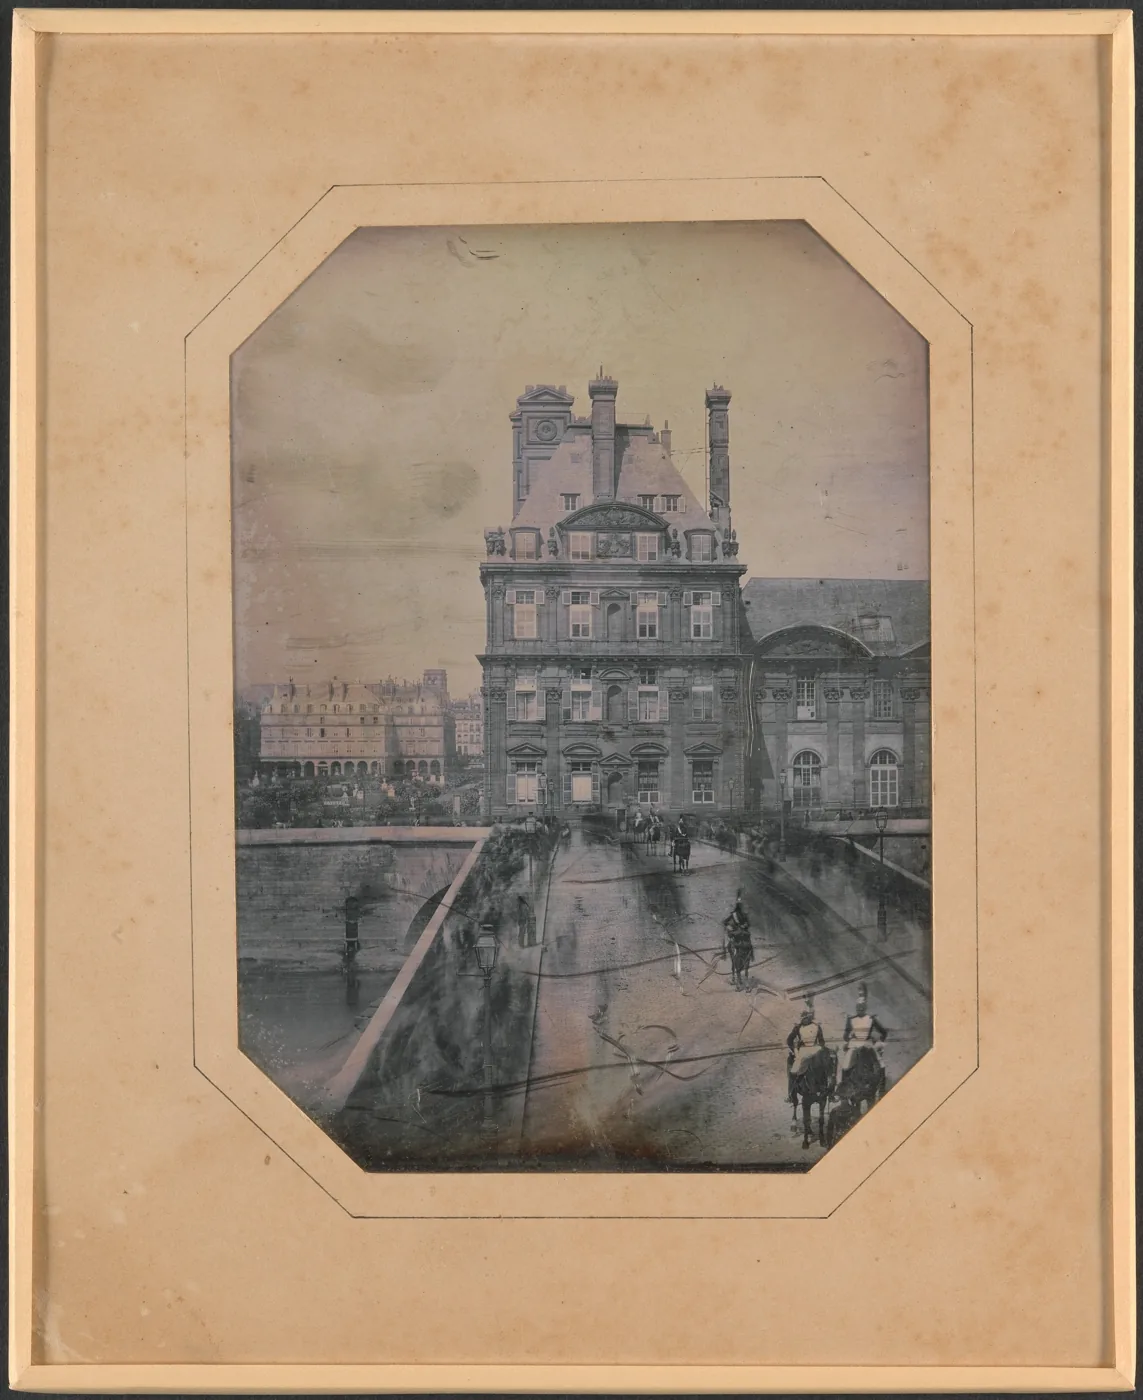
Défilé sur le Pont-Royal, 1844. Daguerreotype by Choiselat and Ratel. The Met, 2005.100.185. Public domain. · Image credit and rights 24.2 million troy ounces
In 1844, two photographers caught mounted guards on a Paris bridge on silver-plated copper. Later photographic films put light-sensitive silver compounds to work in a different way. Digital cameras changed the scale of this market, but photographic materials still register in the annual totals.
Data source: World Silver Survey 2026, p. 9
5 in the countdown
Silverware
2025 demand
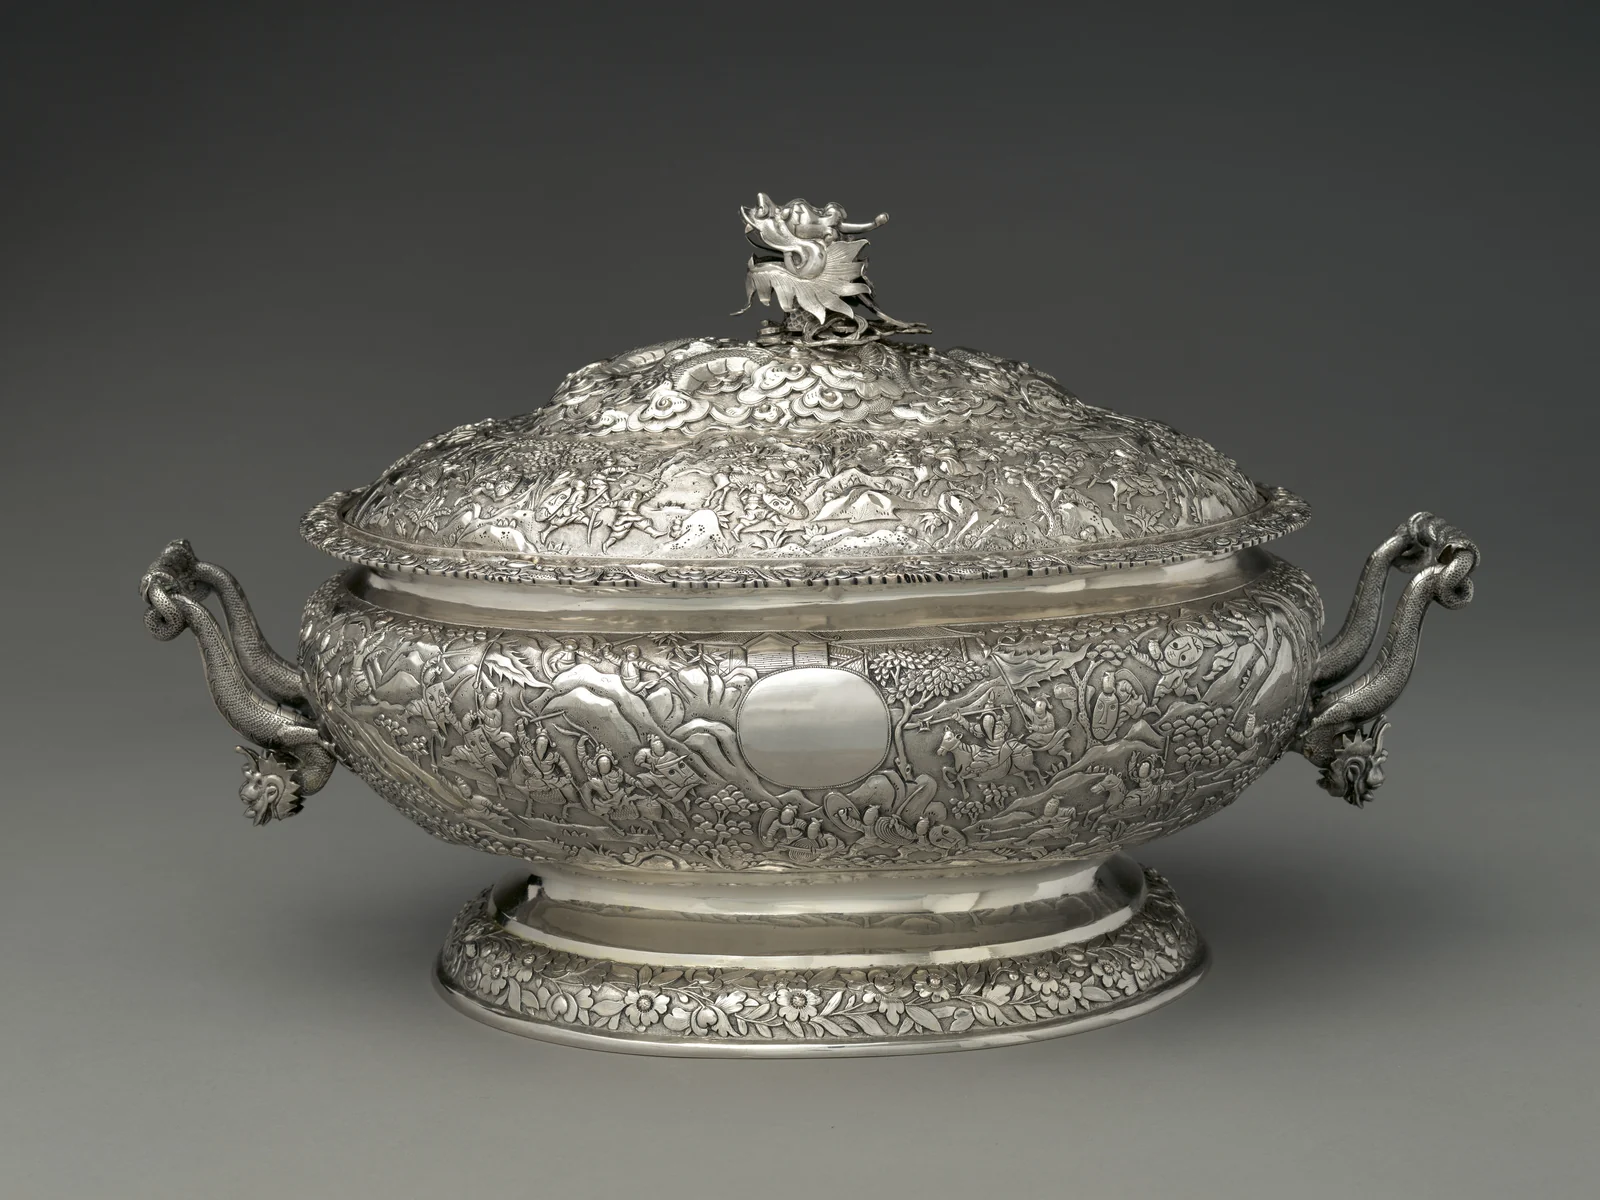
Silver soup tureen made in China for the American market, about 1865. The Met, 67.109a,b. Public domain. · Image credit and rights 42.1 million troy ounces
Look at the dragon handles on this nineteenth-century tureen, made in China for the American market. A serving piece could travel far from its maker and stay in a family for generations. This figure tracks demand for silverware in 2025, not the weight of all the pieces people still own.
Data source: World Silver Survey 2026, p. 9
4 in the countdown
Photovoltaics
2025 demand
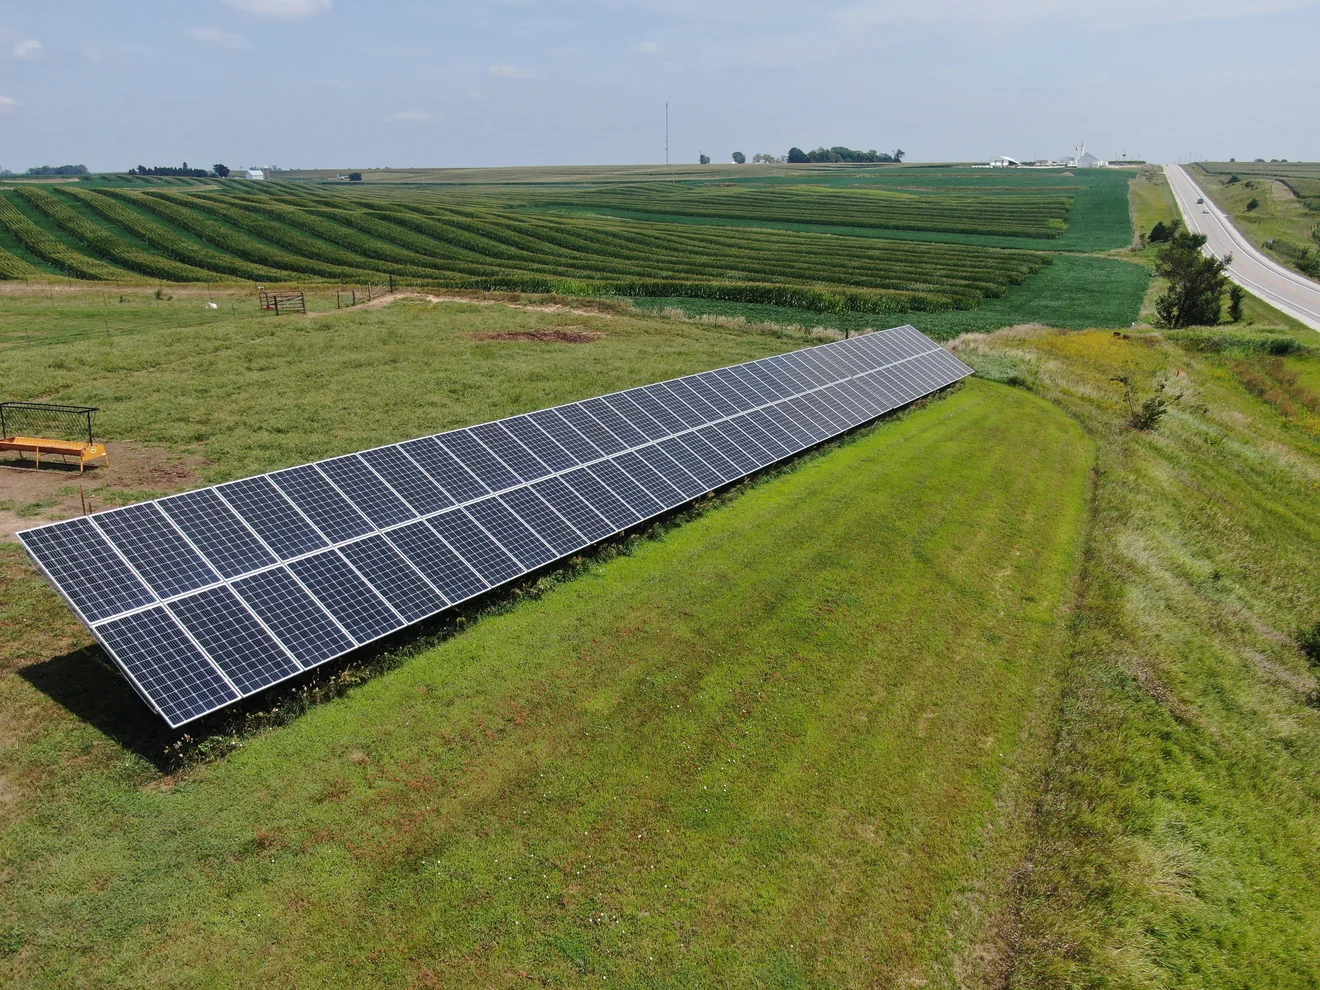
A farm solar array, photographed in 2024. David Kosling, U.S. Department of Agriculture. U.S. public domain. · Image credit and rights 186.6 million troy ounces
Zoom in from a field of panels to a single cell: fine conductive contacts help carry away the current the cell generates. The survey found that solar manufacturers used less silver in 2025 as they reduced silver per cell or substituted other materials. Even so, solar came within 2.7 million ounces of the next category.
Data source: World Silver Survey 2026, p. 9
3 in the countdown
Jewelry
2025 demand
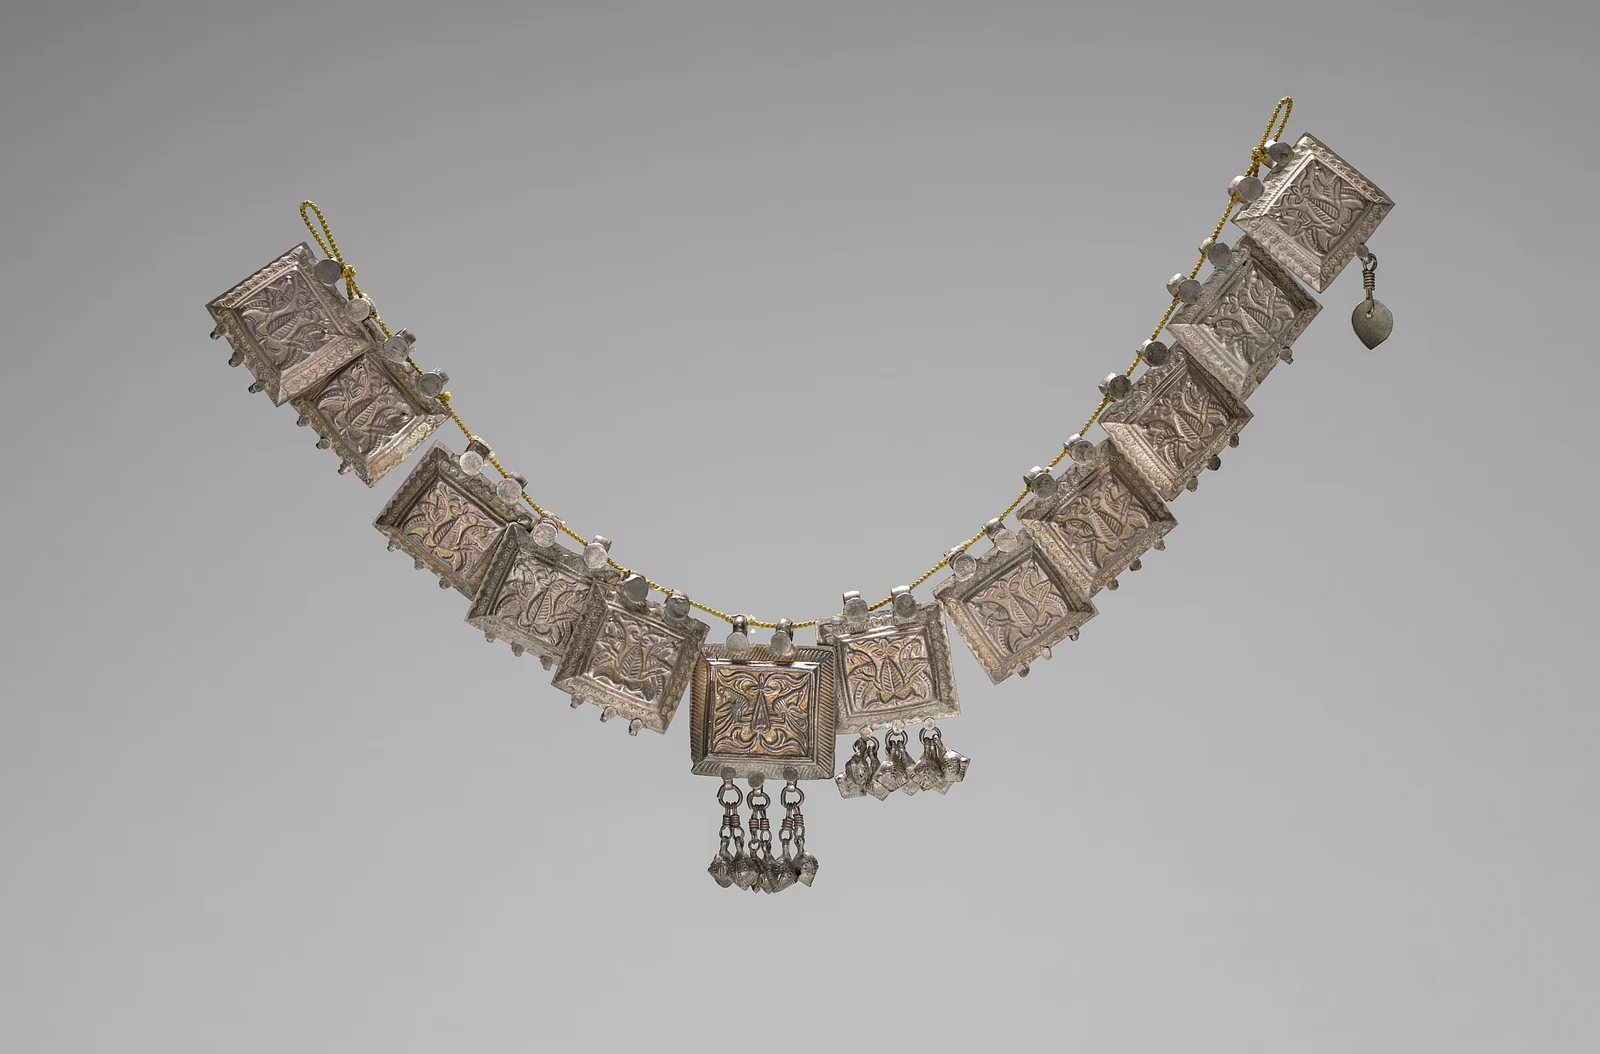
Silver necklace from Punjab, India, 1800s. Cleveland Museum of Art, 1916.257, Gift of Mr. and Mrs. J. H. Wade. CC0. · Image credit and rights 189.3 million troy ounces
A necklace might use silver in a row of thin plaques; a ring in a single band. Across all those small objects, jewelry edged out solar in the 2025 estimates. This is the weight of silver demanded for jewelry, not the number of pieces sold or how much buyers paid.
Data source: World Silver Survey 2026, p. 9
2 in the countdown
Coin & Net Bar Demand
2025 demand
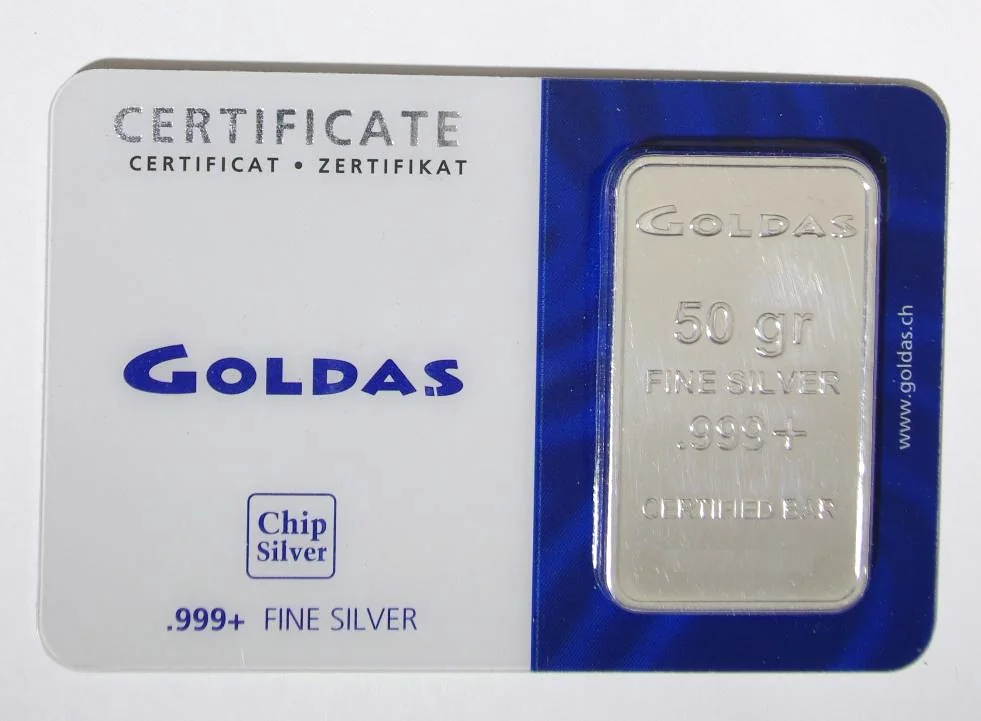
Silver bullion bar in an assay card, photographed by Kjmonkey. Wikimedia Commons, CC0. Shown as an example, not an endorsement. · Image credit and rights 217.7 million troy ounces
Collectors recognize this form on sight: a little silver bar in an assay card, ready to be put away rather than built into a product. The survey groups coins with net bar demand. Its figure isn’t the total silver in anyone’s stack and doesn’t count flows into exchange-traded products.
Data source: World Silver Survey 2026, p. 9
The grand finale
1 in the countdown
Industry excluding photovoltaics
2025 demand
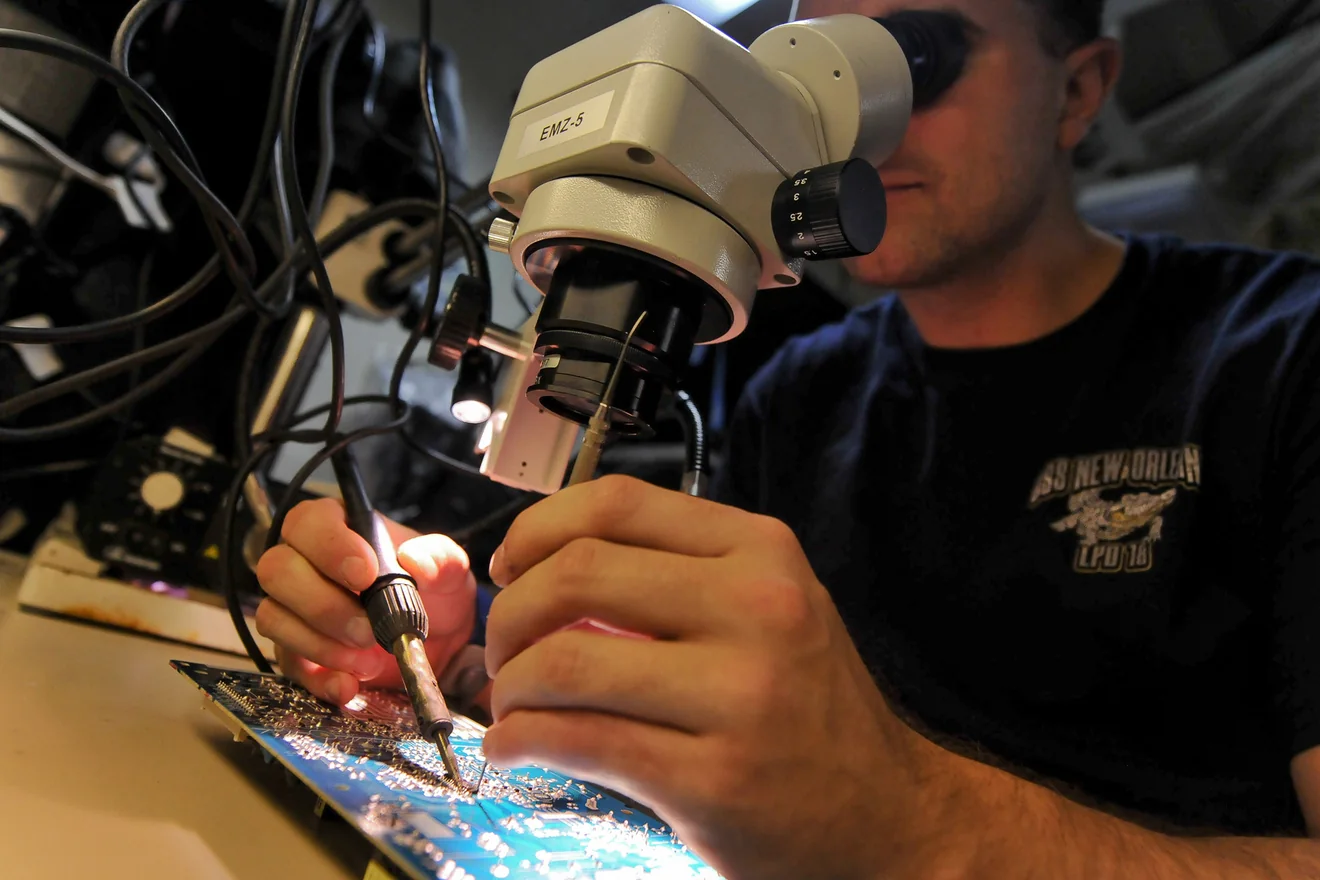
A U.S. Navy technician solders a chip to a training board in 2013. The alloy in this photograph is not specified. Gary Granger Jr., U.S. Navy. U.S. public domain. · Image credit and rights 470.8 million troy ounces
Take solar out completely and industry still comes first, at about 42% of the survey’s global demand. This is not one giant customer. It’s the combined weight of uses such as electrical contacts, brazing and solder alloys, and industrial catalysts. Put solar back in and industry accounts for 657.4 million troy ounces, about 58% of total demand.
Data source: World Silver Survey 2026, p. 9
What happens after silver has been used? Count down where recycled silver came from in 2025.
That was the demand side. Now see which countries mined the most silver.
You’ve reached number one.
Back to the JournalHow we ranked them
We ranked six non-overlapping categories from smallest to largest using 2025 demand in the Silver Institute’s World Silver Survey 2026, page 9. All figures are million troy ounces, not numbers of objects. Photography, silverware, jewelry, and coin and net bar demand use the reported categories.
Photovoltaics is already included in total industrial demand. To show it separately without double-counting, we subtract 186.6 from 657.4 million ounces, leaving 470.8 million ounces for industry excluding photovoltaics. That final category is a calculated remainder, not a separately reported table row.
The report gives total demand as 1,130.6 million ounces. These displayed one-decimal categories sum to 1,130.7 million ounces because the published components are rounded. The headline rounds the reported total to 1.13 billion ounces. Exchange-traded product flows are separate and are not added to this countdown.
This is annual demand, not all the silver people own and not a count of newly mined silver. The photographs illustrate the categories; they are not measurements of 2025 production or evidence that the pictured objects were made that year.