
Where Did 197.6 Million Ounces of Recycled Silver Come From?
Five sources returned silver to the world’s supply in 2025. Count up from the smallest to the biggest.
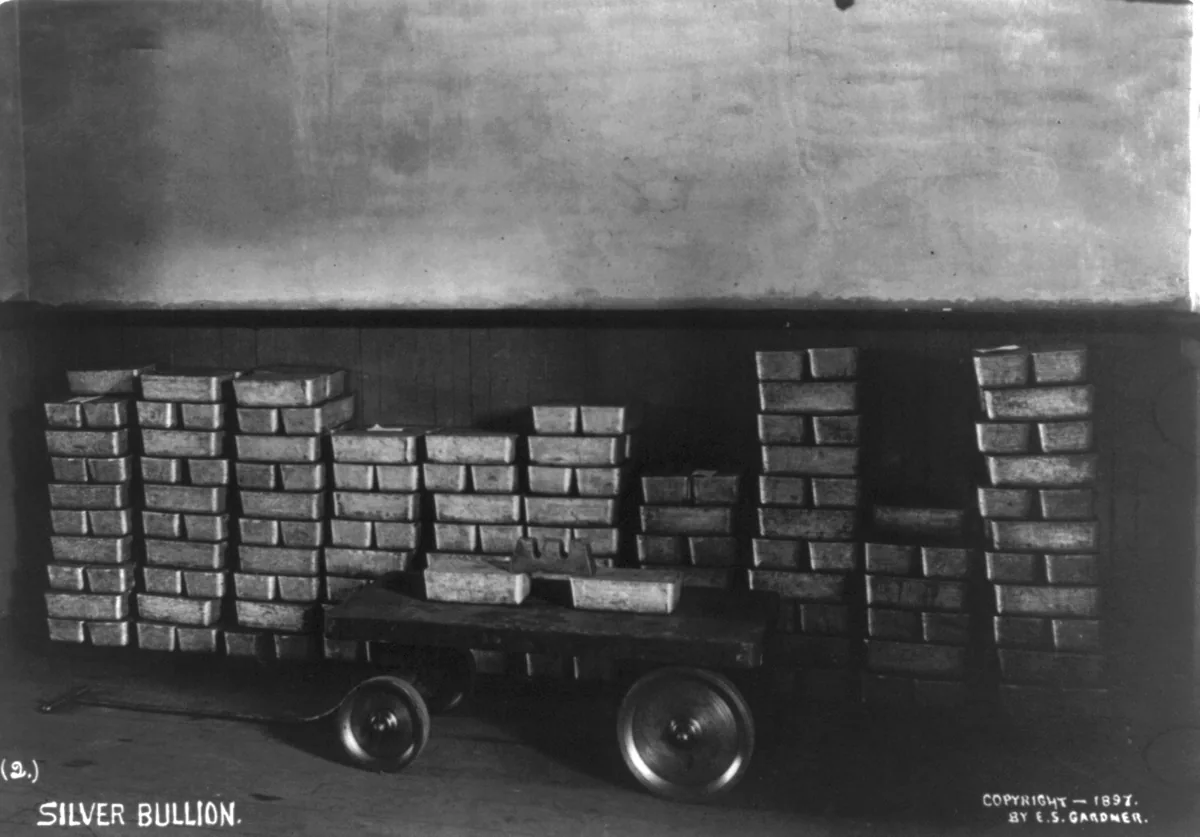
A silver spoon can stay in a drawer for decades. A piece of used film may not look like it contains any metal at all. In 2025, material like this returned an estimated 197.6 million troy ounces of silver to the world’s supply. Which source gave us the most?
Start at No. 5 and count up. This is silver that came back out of products, not everything that changed hands secondhand. The photographs show examples, not objects known to have been recycled.
The countdown
5 in the countdown
Coin
2.4% of 2025 global recycling
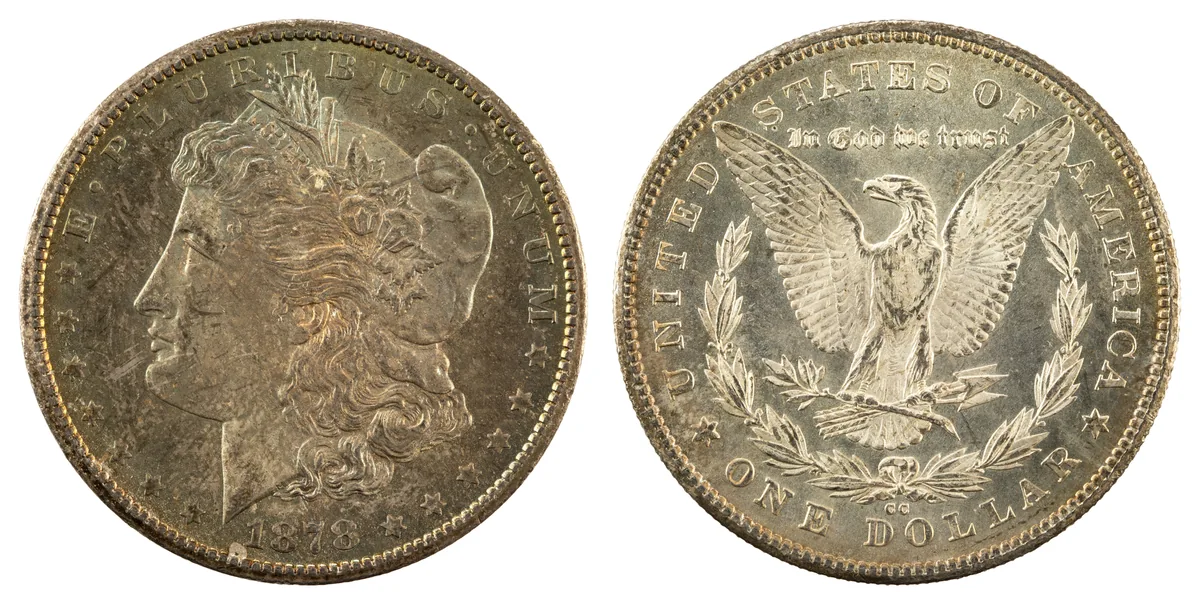
1878-CC Morgan silver dollar. Jaclyn Nash, Smithsonian National Numismatic Collection, U.S. public domain. · Image credit and rights 4.7 million troy ounces
Turn a silver dollar over and the mint mark helps tell its story as a coin. Melting takes that information away. Selling a coin to someone who keeps it intact is resale; recovering its silver as raw material is recycling. The survey puts recovery from coins at 4.7 million troy ounces in 2025, up from 4.4 million the year before. The old dollar shown here is in the National Numismatic Collection, not evidence of a coin sent to a refiner.
Data source: World Silver Survey 2026, p. 40 · Survey methodology
4 in the countdown
Photographic
8.2% of 2025 global recycling
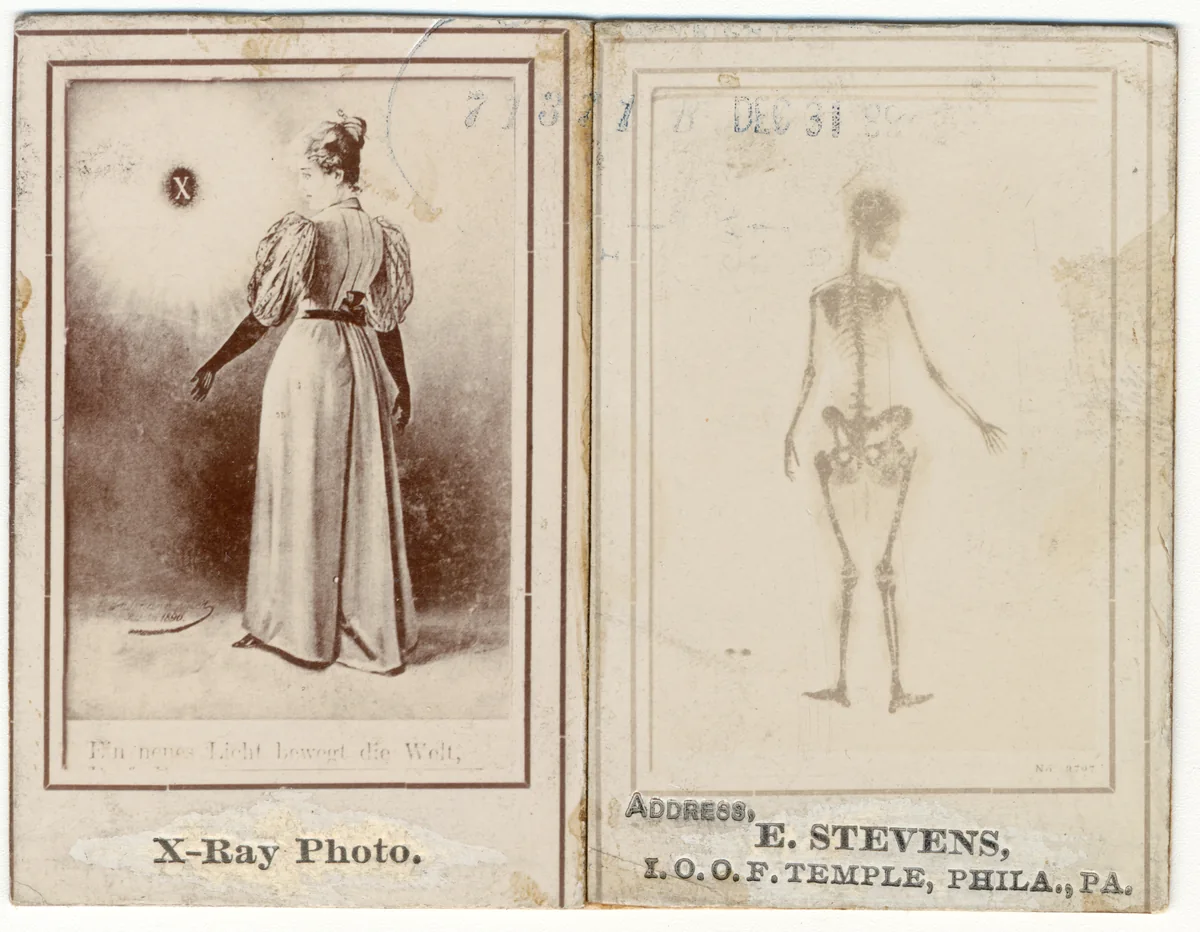
E. Stevens’s 1896 gelatin silver print juxtaposes a lithograph (left) and an early radiograph (right). Library of Congress, public domain. · Image credit and rights 16.2 million troy ounces
An early X-ray image captured in silver could outlast the equipment that made it. When analog film is discarded, silver in it can be recovered. As medical imaging shifted to digital, less old X-ray film was available to enter this stream. The survey found that higher prices encouraged more returns in some places, but didn’t reverse the global decline: photographic recycling fell about 3% in 2025.
Data source: World Silver Survey 2026, p. 40 · Survey methodology
3 in the countdown
Silverware
14.3% of 2025 global recycling
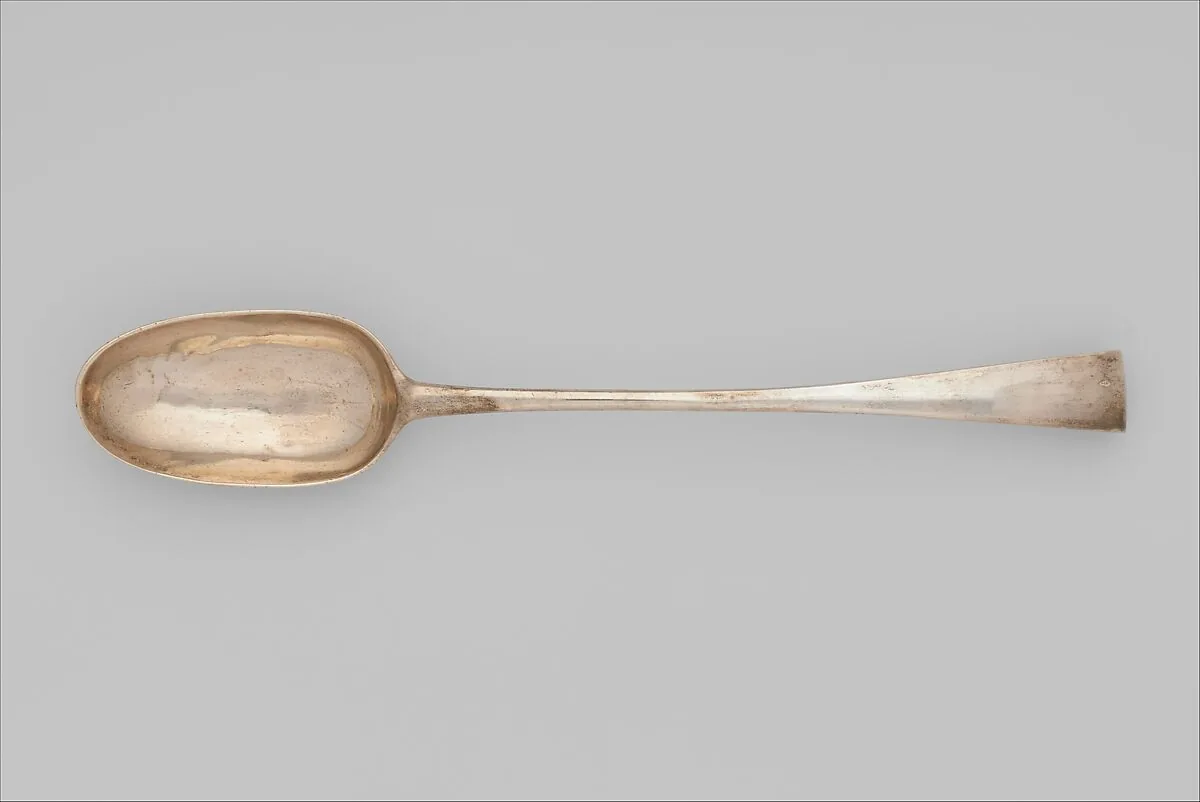
American silver serving spoon, 1725–50. The Metropolitan Museum of Art, 33.120.388, public domain. · Image credit and rights 28.3 million troy ounces
A serving spoon doesn’t cease to be useful when its scrap value rises. But in 2025 the higher price did persuade more people to let go of old silverware. Silver recovered from the category rose 7%, with notable gains in Europe and India. In North America the flow was limited by how much material refiners could take on. A higher price can send more material toward a refinery without moving it any faster through the plant.
Data source: World Silver Survey 2026, p. 40 · Survey methodology
2 in the countdown
Jewelry
19.3% of 2025 global recycling
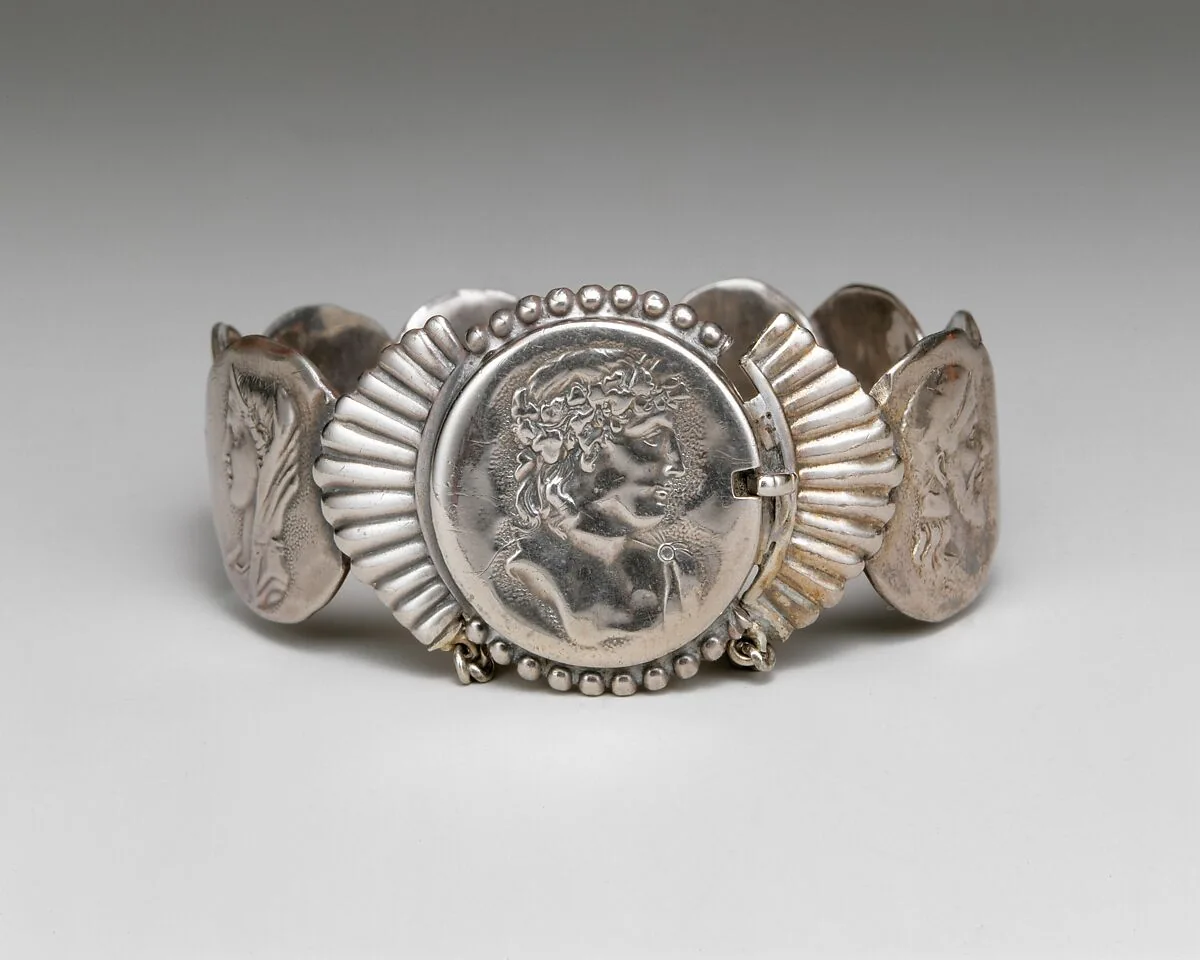
Silver bracelet by George W. Shiebler & Co., ca. 1880. The Metropolitan Museum of Art, 2001.329, public domain. · Image credit and rights 38.2 million troy ounces
A silver bracelet can go back on a wrist, into a repair shop, or into the refining stream. Only the last path counts here. The survey recorded 38.2 million troy ounces from jewelry in 2025, about 6% more than in 2024. Higher prices prompted more selling in several markets. Jewelry and silverware together provided about a third of the year's recovered metal, but neither came close to the largest source.
Data source: World Silver Survey 2026, p. 40 · Survey methodology
The grand finale
1 in the countdown
Industrial
55.7% of 2025 global recycling
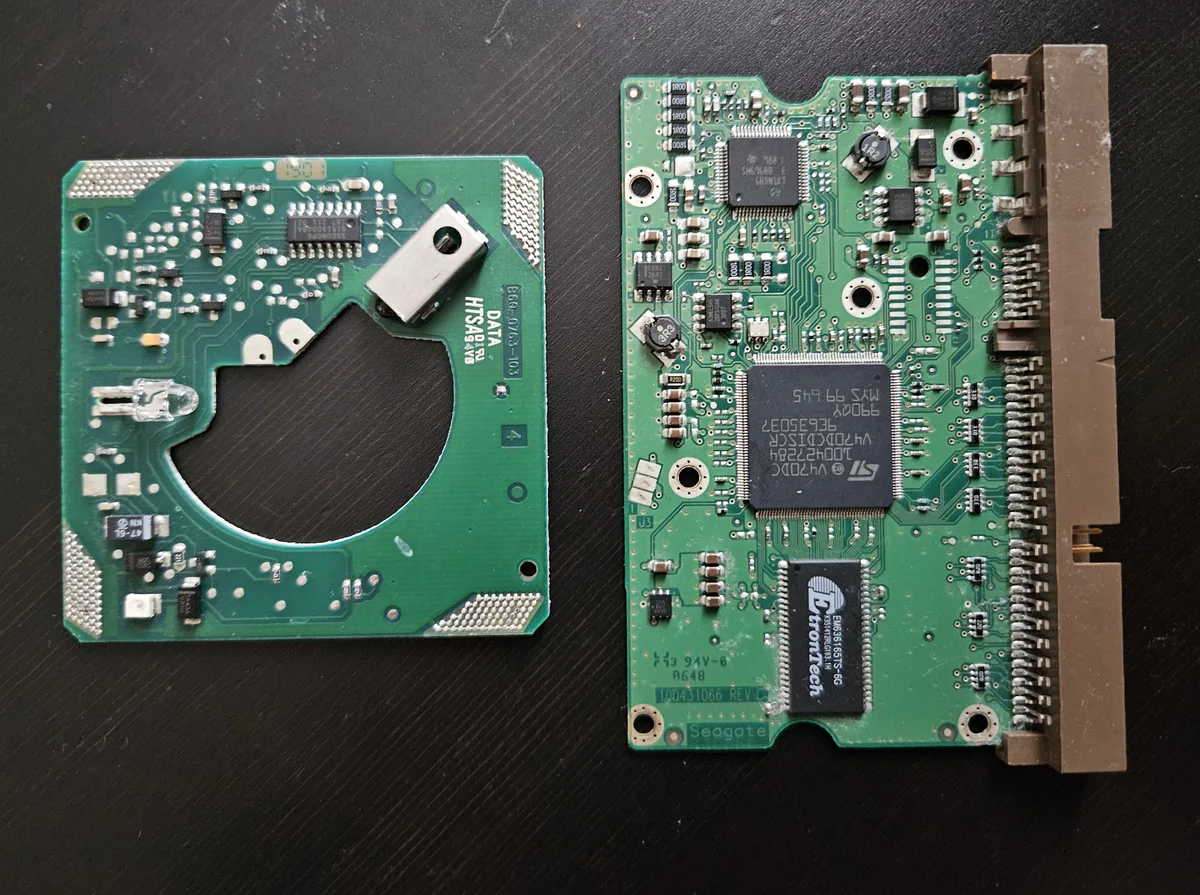
Printed circuit boards photographed by IMG 4512, CC0. These boards illustrate electronic hardware; their silver content is not established. · Image credit and rights 110.1 million troy ounces
The largest stream isn’t the one most people could gather from a drawer. It’s material returned from industry, including electronic scrap and spent catalysts used to make the chemical ethylene oxide. The two streams moved in different directions: more catalyst silver came back, but the amount recovered from electronic scrap fell even as more electronic scrap by gross weight was processed. Newer equipment tended to contain less silver. Industry still supplied more than the other four categories combined, even though its own contribution slipped just under 1%. Old solar panels were a small part of recovery in the survey, even though new panels were a much larger part of silver demand. Those are two different questions.
Data source: World Silver Survey 2026, p. 40 · Survey methodology
Follow the metal: how silver is recycled, where silver demand came from, and which countries mined the most silver.
You’ve reached number one.
Back to the JournalHow we ranked them
We ranked the five reported categories by estimated silver recovered worldwide in 2025, using Metals Focus’s Recycling by Source table in the Silver Institute’s World Silver Survey 2026, p. 40. The published total is 197.6 million troy ounces. The rounded categories add to 197.5. Shares use the published total and are rounded separately.
The survey counts silver recovered from fabricated products, including unused trade stocks. It excludes scrap generated during manufacturing. It does not count intact resale or measure all the silver still in use. A category’s share of recovered ounces is not the percentage of its products that got recycled.