
Which Country Mined the Most Silver in 2025?
Count down the five biggest silver-mining countries, from 49.9 million ounces to the global leader.
In 2025, the world mined 846.6 million troy ounces of silver. The top five countries supplied more than three out of every five ounces, but plenty came from mines better known for other metals.
Start at No. 5 and work your way up. Two countries swapped places from the previous year, and the largest producer held its lead despite a drop in output.
The countdown
5 in the countdown
Bolivia
+4% from 2024
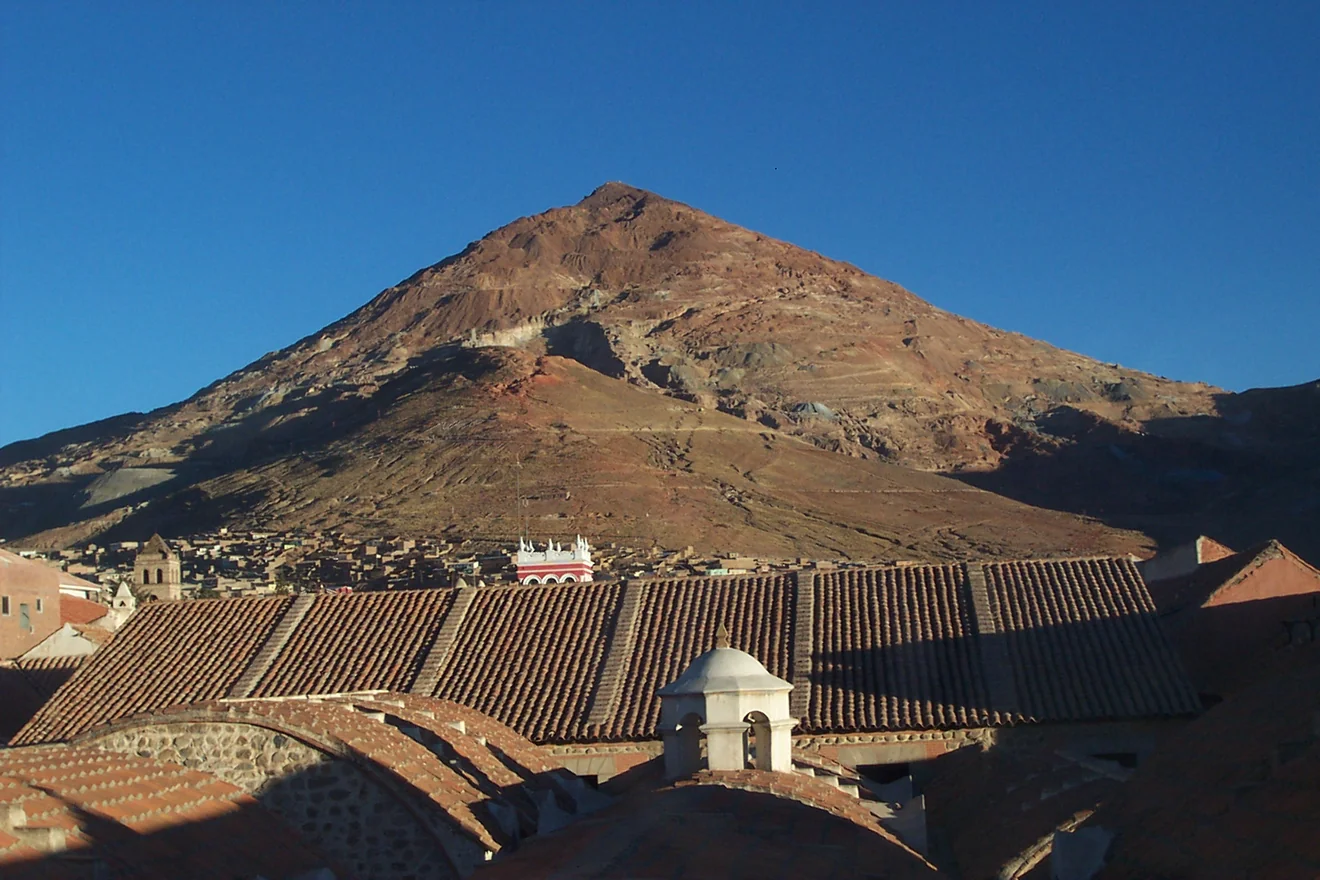
Cerro Rico above Potosí, Bolivia, in 2002. This is the historic silver mountain, not the San Cristóbal mine. Mhwater, public-domain dedication. · Image credit and rights 49.9 million troy ounces
At San Cristóbal, silver comes out alongside lead and zinc. Bolivia mined more silver than it did in 2024, but another country grew faster and took its place at No. 4.
Data source: World Silver Survey 2026, p. 28 · Photo context
4 in the countdown
Russia
+23% from 2024
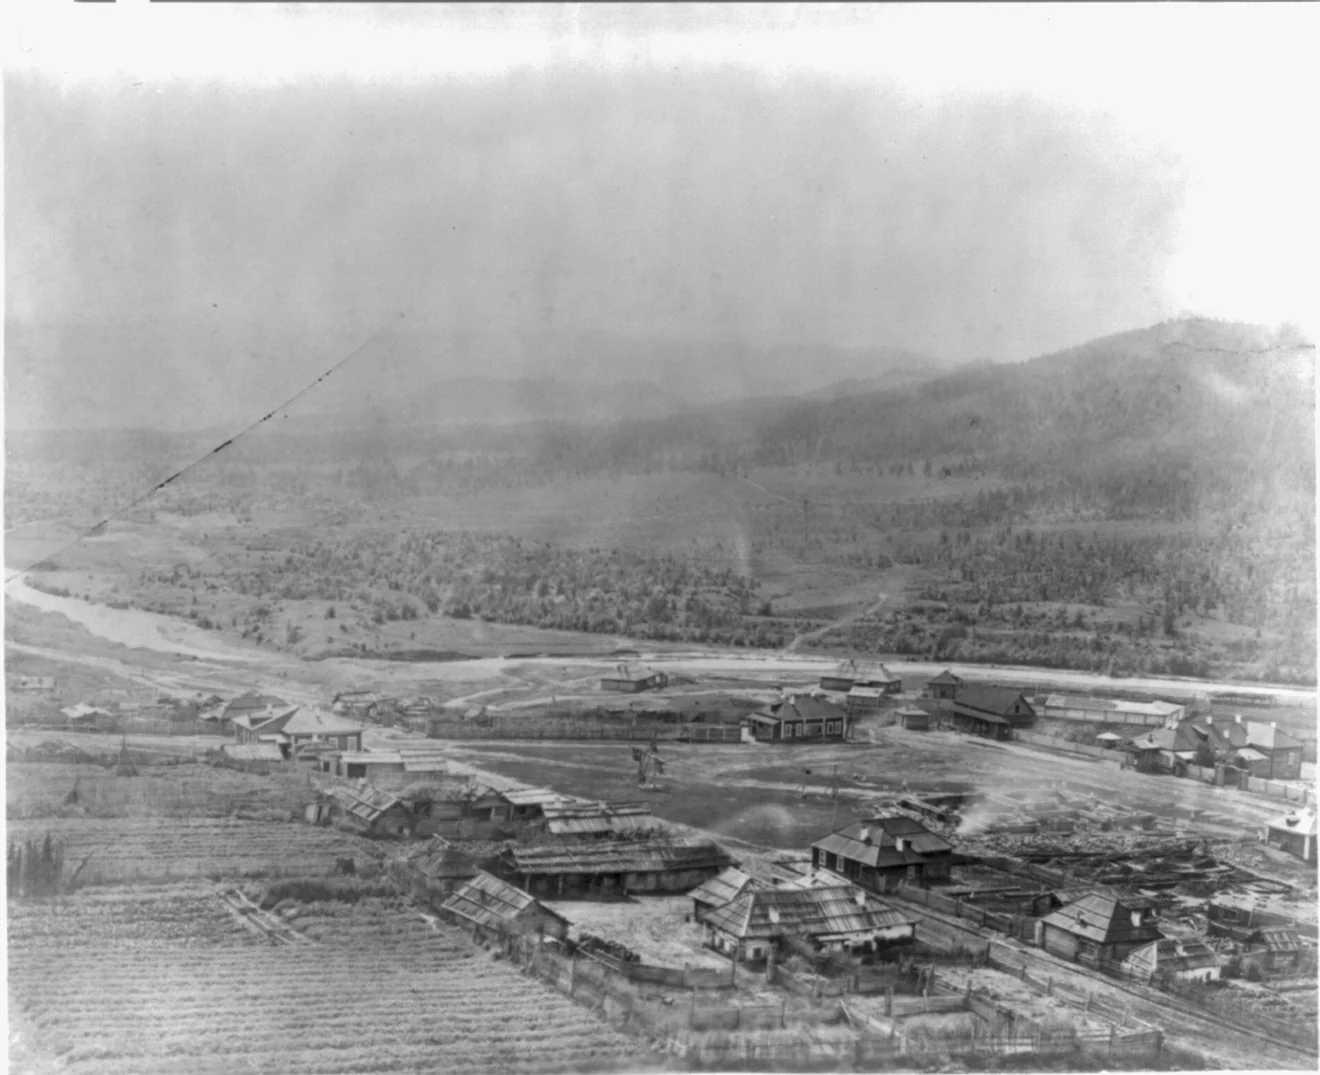
The Warasun silver mines near Nerchinsk, eastern Siberia, about 1900, as identified in the Library of Congress catalog. A. K. Kuznetsov, public domain. Not the modern Prognoz operation. · Image credit and rights 56.0 million troy ounces
The biggest percentage gain in this top five came as the Prognoz mine increased production. Its ore was processed at the Nezhda concentrator, a reminder that where ore is mined and where it is concentrated need not be the same place.
Data source: World Silver Survey 2026, p. 28
3 in the countdown
China
+3% from 2024
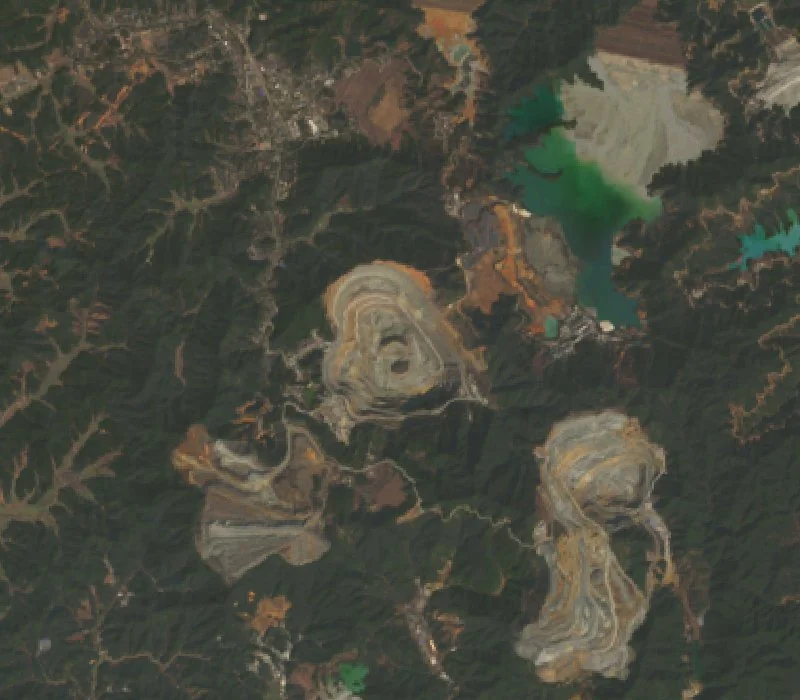
The Dexing copper-mining complex in Jiangxi, which also produces silver. Landsat 9 natural-color view, February 9, 2025. USGS and NASA, U.S. public domain. · Image credit and rights 112.8 million troy ounces
China is one of the largest sources of the silver that comes from lead and zinc mines. Its 2025 gains also got a lift from higher output at Jiama, a copper-gold mine.
Data source: World Silver Survey 2026, p. 28 · Photo context
2 in the countdown
Peru
+7% from 2024
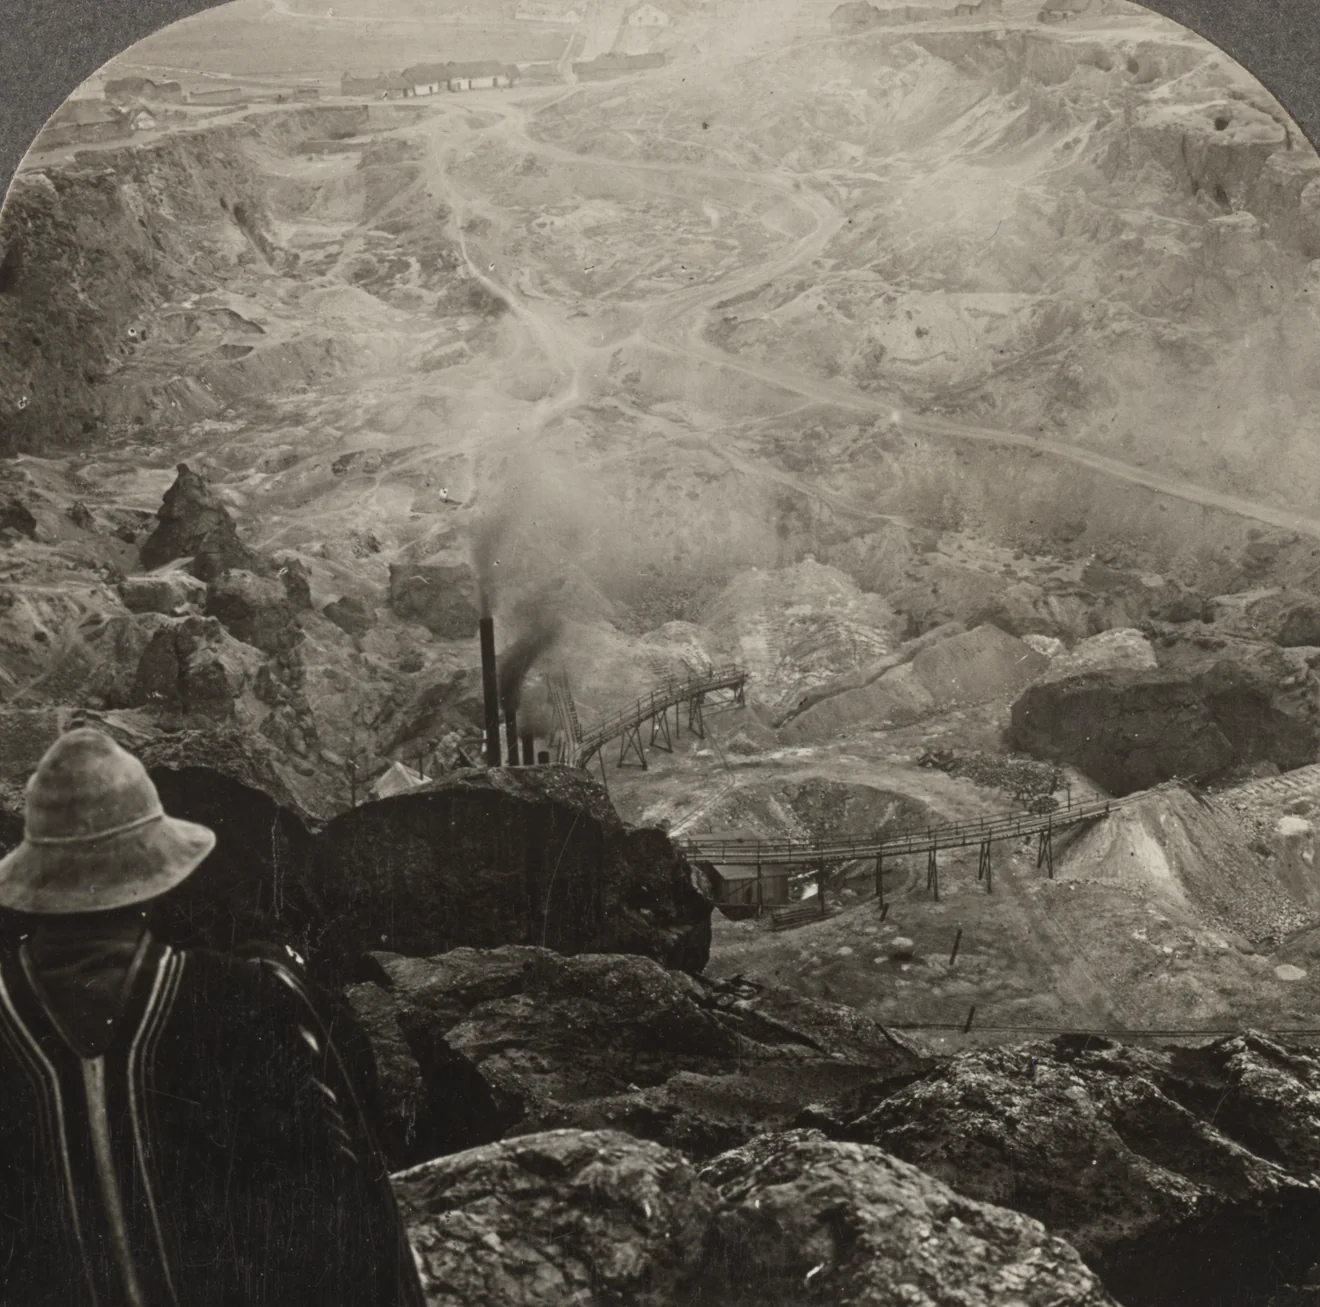
An old silver mine at Cerro de Pasco, Peru, on a Keystone stereograph from 1910 or earlier. Single panel from the Library of Congress scan, U.S. public domain. Not Antamina. · Image credit and rights 130.6 million troy ounces
Copper helped lift Peru’s silver total. At Antamina, higher grades helped bring more silver out alongside the copper, an example of how the metal in the ore can matter as much as the amount mined.
Data source: World Silver Survey 2026, p. 28
The grand finale
1 in the countdown
Mexico
−5% from 2024
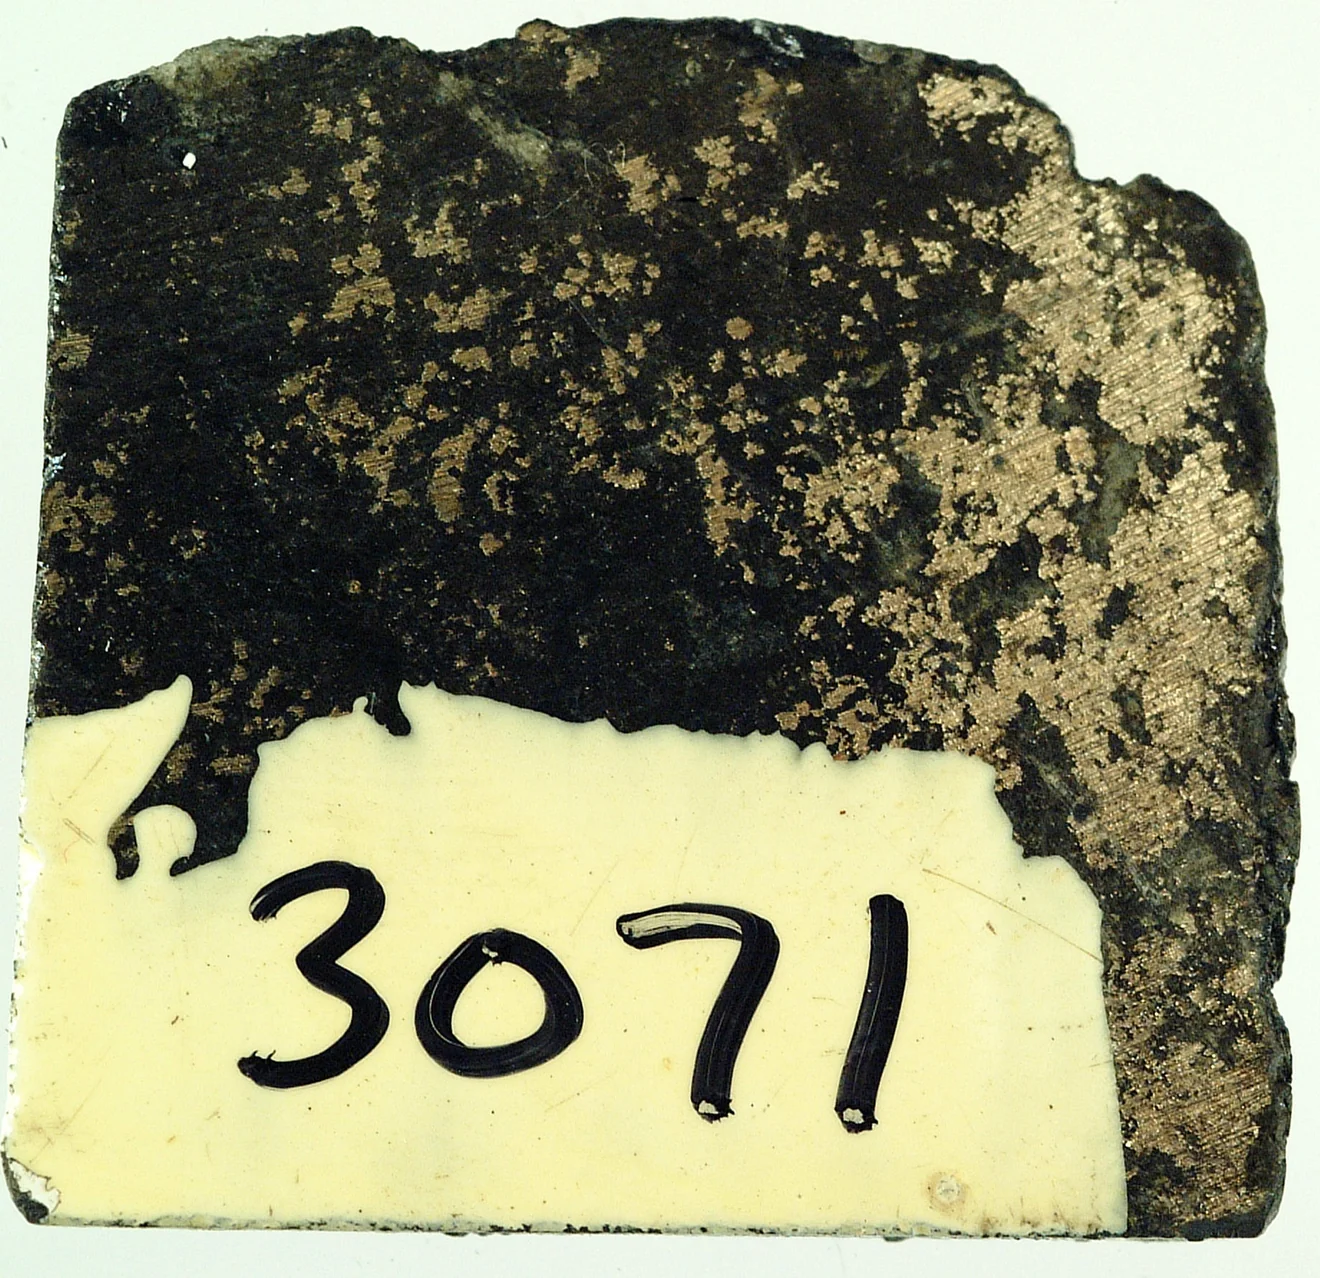
Native silver in a polished basalt specimen from the New Nevada Mine near Batopilas, Chihuahua. Darla Sondrol, GeoDIL 894, University of North Dakota Mineralogy Collection, CC0. Not Peñasquito ore. · Image credit and rights 172.9 million troy ounces
Mexico stayed at No. 1 even as its silver output fell. Peñasquito processed more ore, but that ore contained less silver per tonne, so the mine produced fewer ounces.
Data source: World Silver Survey 2026, p. 28 · Photo context
What happens after silver has been used? Count down where recycled silver came from in 2025.
That was the mining side. Now see where silver demand came from in 2025.
You’ve reached number one.
Back to the JournalHow we ranked them
We ranked countries by 2025 mine production using the country table on printed page 28 of the Silver Institute’s World Silver Survey 2026, researched by Metals Focus. All volumes are in million troy ounces. Each percentage change compares 2025 with the revised 2024 figures in that same table.
The five displayed figures add to 522.2 million troy ounces, or 61.7% of the published world total of 846.6 million. The ranking includes silver recovered alongside other metals, not just output from primary silver mines.
These are mine-production estimates, not a ranking of silver refining, recycling or reserves in the ground. The photos illustrate the countries or their mining history; they are not evidence of 2025 output.